Foster & Pearson Ltd - Profit & Loss Account - 1893/4 to 1927/8
| Year | Revenue (Ł) | Expenditure (Ł) | Ended | Sales | Other | Total | Direct Costs | Other | Total | Net | 31 March | 3rd Party | Foundry | Income | Materials | Wages | Costs | Profit (Ł) | 1894 | 8,659 | 187 | 237 | 9,083 | 3,073 | 2,775 | 2,116 | 7,964 | 1,119 | 1895 | 9,538 | 126 | 225 | 9,889 | 3,392 | 2,746 | 2,032 | 8,170 | 1,719 | 1896 | 10,984 | 178 | 237 | 11,399 | 3,583 | 3,511 | 1,686 | 8,780 | 2,619 | 1897 | 8,891 | 1,268 | 216 | 10,375 | 3,673 | 3,141 | 1,474 | 8,288 | 2,087 | 1898 | 10,810 | 670 | 120 | 11,600 | 3,733 | 3,681 | 1,685 | 9,099 | 2,501 | 1899 | 9,726 | 418 | 92 | 10,236 | 3,257 | 3,682 | 1,715 | 8,654 | 1,582 | 1900 | 16,152 | 124 | 101 | 16,377 | 5,079 | 4,812 | 2,311 | 12,202 | 4,175 | 1901 | 15,984 | 238 | 91 | 16,313 | 5,618 | 5,373 | 2,191 | 13,182 | 3,131 | 1902 | 20,175 | 545 | 123 | 20,843 | 8,176 | 5,895 | 2,402 | 16,473 | 4,370 | 1903 | 18,459 | 391 | 107 | 18,957 | 7,012 | 5,956 | 2,565 | 15,533 | 3,424 | 1904 | 26,111 | 200 | 107 | 26,418 | 9,566 | 6,787 | 3,100 | 19,453 | 6,965 | 1905 | 22,934 | 282 | 174 | 23,390 | 8,314 | 6,847 | 2,948 | 18,109 | 5,281 | 1906 | 18,546 | 287 | 101 | 18,934 | 7,181 | 5,701 | 2,908 | 15,790 | 3,144 | 1907 | 23,254 | 789 | 96 | 24,139 | 10,228 | 6,863 | 3,143 | 20,234 | 3,905 | 1908 | 21,127 | 466 | 95 | 21,688 | 9,105 | 5,470 | 3,,014 | 17,589 | 4,099 | 1909 | 13,407 | 504 | 73 | 13,984 | 5,422 | 4,068 | 2,599 | 12,089 | 1,895 | 1910 | Not available | 1911 | 20,073 | 683 | 143 | 20,899 | 9,529 | 5,031 | 2,355 | 16,915 | 3,984 | 1912 | 17,723 | 656 | 162 | 18,541 | 7,522 | 5,119 | 2,312 | 14,953 | 3,588 | 1913 | 20,760 | 1,275 | 179 | 22,214 | 9,282 | 5,949 | 2,469 | 17,700 | 4,514 | 1914 | 21,979 | 183 | 207 | 22,369 | 8,511 | 5,939 | 2,743 | 17,193 | 5,176 | 1915 | 12,529 | 684 | 183 | 13,396 | 5,366 | 3,817 | 2,099 | 11,282 | 2,114 | 1916 | 8,762 | 369 | 100 | 9,231 | 4,121 | 2,750 | 1,745 | 8,616 | 615 | 1917 | 10,126 | 169 | 101 | 10,396 | 5,187 | 2,510 | 1,586 | 9,283 | 1,113 | 1918 | 11,183 | 462 | 137 | 11,782 | 5,691 | 2,751 | 1,397 | 9,839 | 1,943 | 1919 | 15,340 | 210 | 165 | 15,715 | 7,317 | 3,117 | 1,450 | 11,884 | 3,831 | 1920 | 28,053 | 1,088 | 260 | 29,401 | 11,750 | 6,973 | 2,465 | 21,188 | 8,213 | 1921 | 32,680 | 1,411 | 281 | 34,372 | 15,702 | 9,605 | 4,021 | 29,328 | 5,044 | 1922 | 18,436 | 1,122 | 161 | 19,719 | 8,319 | 6,369 | 3,139 | 17,827 | 1,892 | 1923 | 21,334 | 1,531 | 198 | 23,063 | 8,910 | 6,613 | 2,786 | 18,309 | 4,754 | 1924 | 16,889 | 1,968 | 183 | 19,040 | 7,333 | 5,779 | 3,002 | 16,114 | 2,926 | 1925 | 19,647 | 1,390 | 164 | 21,201 | 8,390 | 6,515 | 2,959 | 17,864 | 3,337 | 1926 | 21,657 | 1,944 | 195 | 23,796 | 8,985 | 7,401 | 3,314 | 19,700 | 4,096 | 1927 | 17,327 | 1,312 | 158 | 18,797 | 6,937 | 6,447 | 3,112 | 16,496 | 2,301 | 1928 | 22,625 | 151 | 22,776 | 9,472 | 6,789 | 3,137 | 19,398 | 3,378 |
The summary of the company's profit & loss account is derived from copies of the audited accounts of the company which survived and were discovered together in a bundle after the company folded in the 1990s. They include almost all years from its formation in 1893/94 to 1927/28, the year of Douglas Hetley Pearson's death. The one exception is the year 1909/10 for which the accounts were missing from the bundle.When considering the figures from a present day viewpoint, an important factor is inflation. Ł10,000 in 1893 would have a purchasing valued today of around one million pounds and someone earning Ł1000 then is the equivalent to earnings of about Ł400,000 today. In broad terms, then, we are looking at a company that was turning over a viable amount and paying its directors well. An overall view would be that we are looking at a reasonably successful. well-funded and stable, middle-size company. However, there are clear signs that it was not really growing, certainly in real-terms. While we will continue to evaluate the results in terms of the values in the accounts, present day equivalents should always be borne in mind. 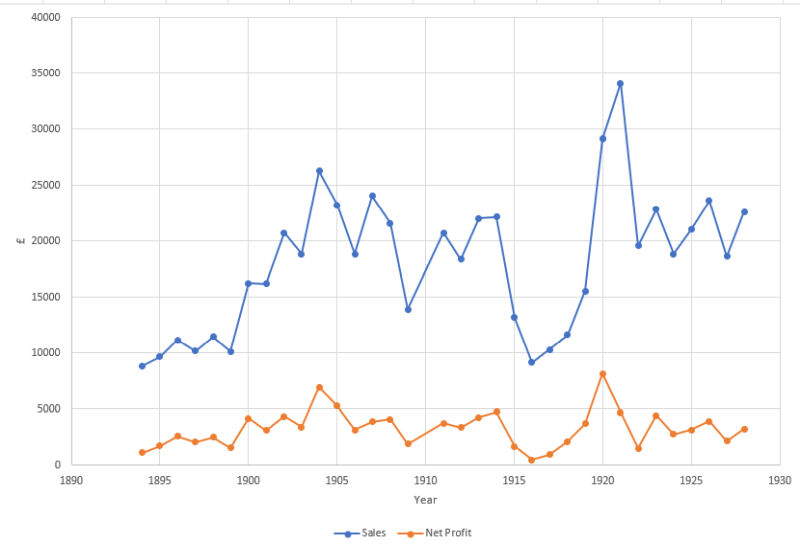 The above graph shows the trend of sales and of net profit over the range of years covered by the accounts. While the accounts, rightly, report sales to Beeston Foundry separately from sales to third parties, we have combined the two values in our analysis of Sales. The following observations can be made:
We have chosen not to include details of the balance sheets, mainly because they show relatively little variation over the years. In summary, however, they record that :
|